Reuters interactive infographic
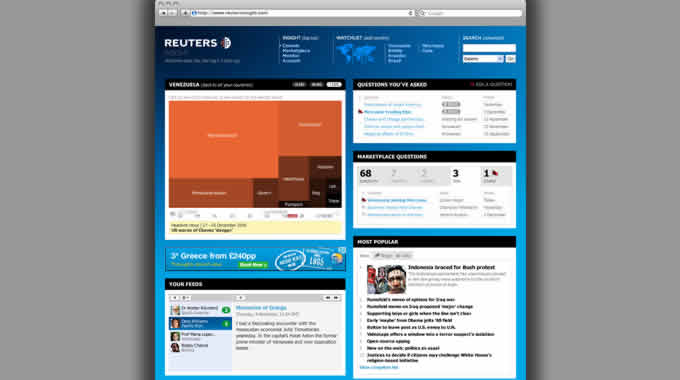
Interactive infographic for Reuters. Reuters developed a community site called Reuters Insight, "helping businesses to discover and understand new overseas markets". On part of the site, the client wanted an interactive visualisation of complex data using a squarified treemap and I was called in to develop it.
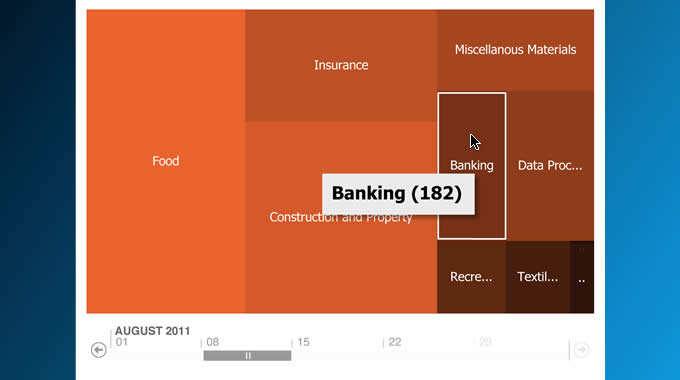
The treemap gives a visualisation of the dominant tags of stories for a particular country or region, that can be used to indicates trends as the user drags the cursor along a calendar timeline. Liaising with the backend database team, I developed this complex Flash-based visualisation tool, having been brought in to deliver to a very tight deadline.


